Aim: Data-driven analysis using large-scale NGS data
"Genome" refers to all genetic information passed down through generations. It contains all the genes necessary for life processes. Various cell types that make up organs such as skin, brain, digestive tract, and bones, express the specific set of genes they require, and the functional units that regulate this expression, such as enhancers, are also included in the genome. These functional regions are subject to chemical modifications (epigenome) that act as "switches" controlling the level and timing of gene expression. Although the genome sequence is identical in all cells of the body, the epigenome shows different patterns in different tissues and plays a critical role in ensuring their proper function. It is remarkable to think that the human genome sequence contains a vast amount of information about life, yet it can be stored within the data capacity of a single DVD.
Individual variations in the genome sequence influence traits such as alcohol tolerance, eye color, and hair color. In addition, problematic mutations or abnormalities in the genome or epigenome can lead to various diseases, including cancer. "Genomics" and "epigenomics" are the fields dedicated to the study of the mechanisms that determine the genomic regions essential for specific biological activities and the effects of various mutations on these regions. Our laboratory specializes in genomics and epigenomics research.
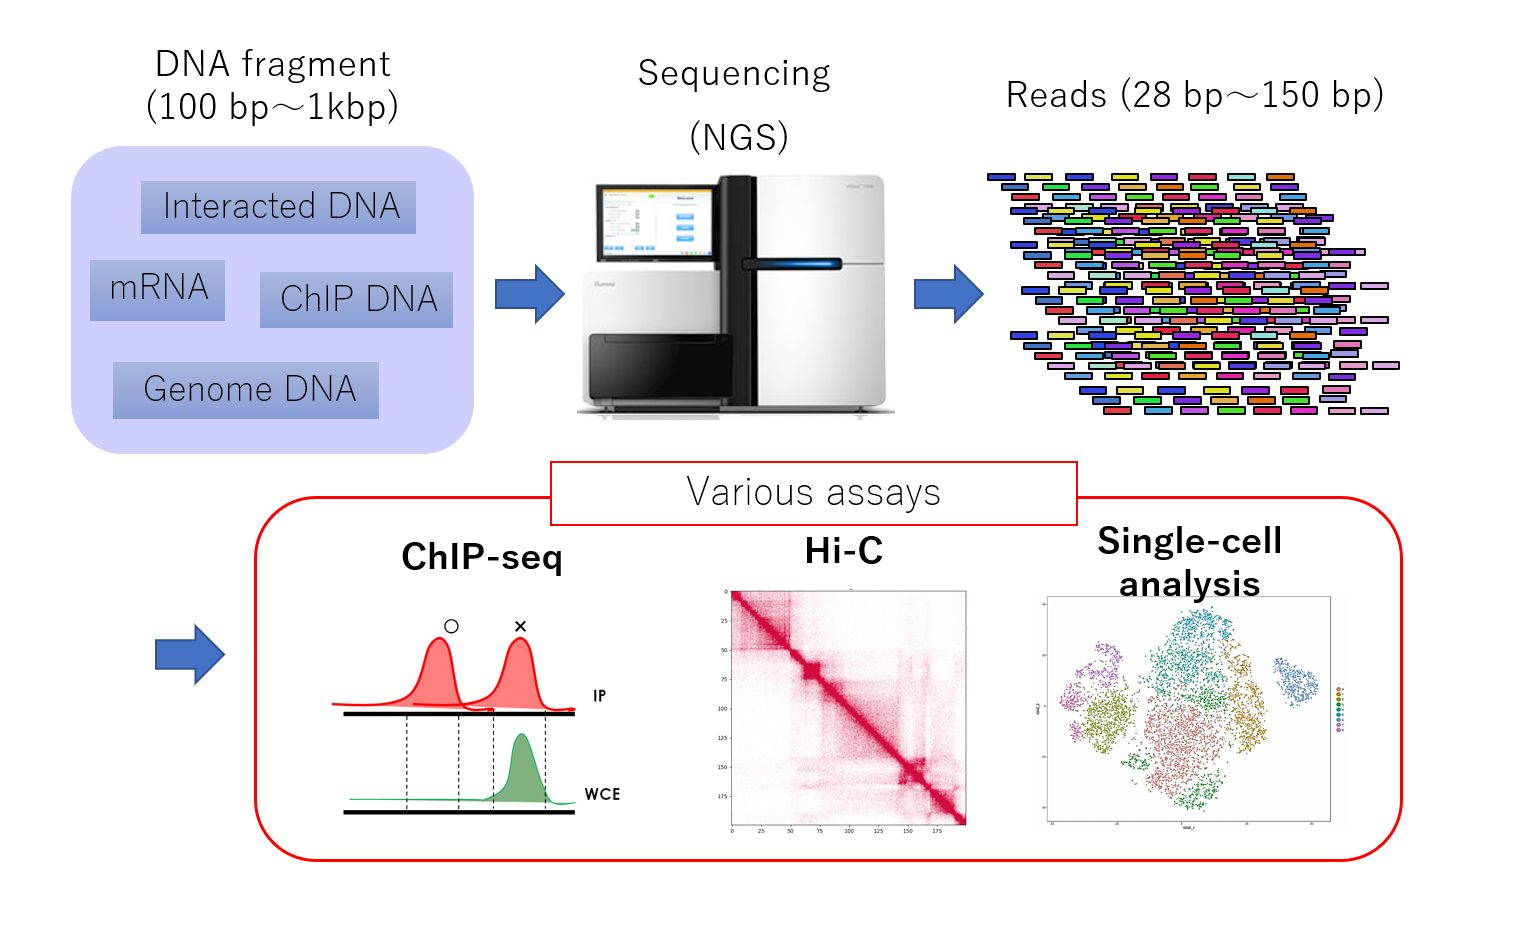
Genome-wide analysis using next-generation sequencing (NGS, above) has become a key method in the fields of genomics and epigenomics. This powerful technique can capture a wide range of genomic information, including gene transcription levels, protein-DNA binding, DNA methylation, genome replication, and the three-dimensional structure of the genome. NGS analysis has paved the way for groundbreaking discoveries related to the dynamic regulation of the genome and its dysregulation in various diseases.
With the exponential growth of available genomic and epigenomic data in recent years, there is a growing demand for "data-driven large-scale NGS analysis". This approach allows researchers to simultaneously analyze vast amounts of NGS data, potentially leading to revolutionary discoveries that challenge previous understandings. Unlike hypothesis-driven analysis, which relies on experiments to test working hypotheses based on existing knowledge, data-driven analysis uncovers new insights by exploiting features inherent in the data itself, without relying on prior knowledge. This method has the potential to elucidate complex and unexpected mechanisms, such as discovering that a particular protein interacts with an unexpected protein in a particular tissue, and how the loss of this interaction may contribute to the onset of a particular type of disease.
Open problems in data-driven genome analysis
So, how do we extract biologically meaningful information from a vast amount of NGS data? Even a single sample of NGS data contains information at the whole genome level, and when it comes to hundreds or thousands of samples, the data volume becomes truly enormous. In addition, the structure and characteristics of the data vary among NGS assays, and data from technically challenging experiments often have significant variations in quality. Since the "true" results are unknown, applying supervised learning is often difficult. Currently, extracting reliable and meaningful insights from large amounts of data, including poor-quality data, is extremely challenging. Despite the high demand, only a few highly skilled researchers can perform such analyses. To draw a parallel with a restaurant, it's like having a variety of ingredients (data) but no preparation for cooking (data formatting), and a lack of utensils (tools) and chefs (analysts) capable of cooking, creating a challenging situation.
Current projects
To overcome these problems, our lab is working on developing a pipeline for "large-scale multi-omics analysis" that integrates multiple datasets consisting of different omics data (Figure). Through projects such as AMED-PRIME "Development of a robust computational platform for data-driven epigenome analysis", we are developing various new methods for epigenome (ChIP-seq), gene expression (RNA-seq), three-dimensional genome structure (Hi-C), single-cell analysis, and other areas. While we focus on the novelty of the algorithms, we also emphasize how much these developments can elucidate important biological insights.
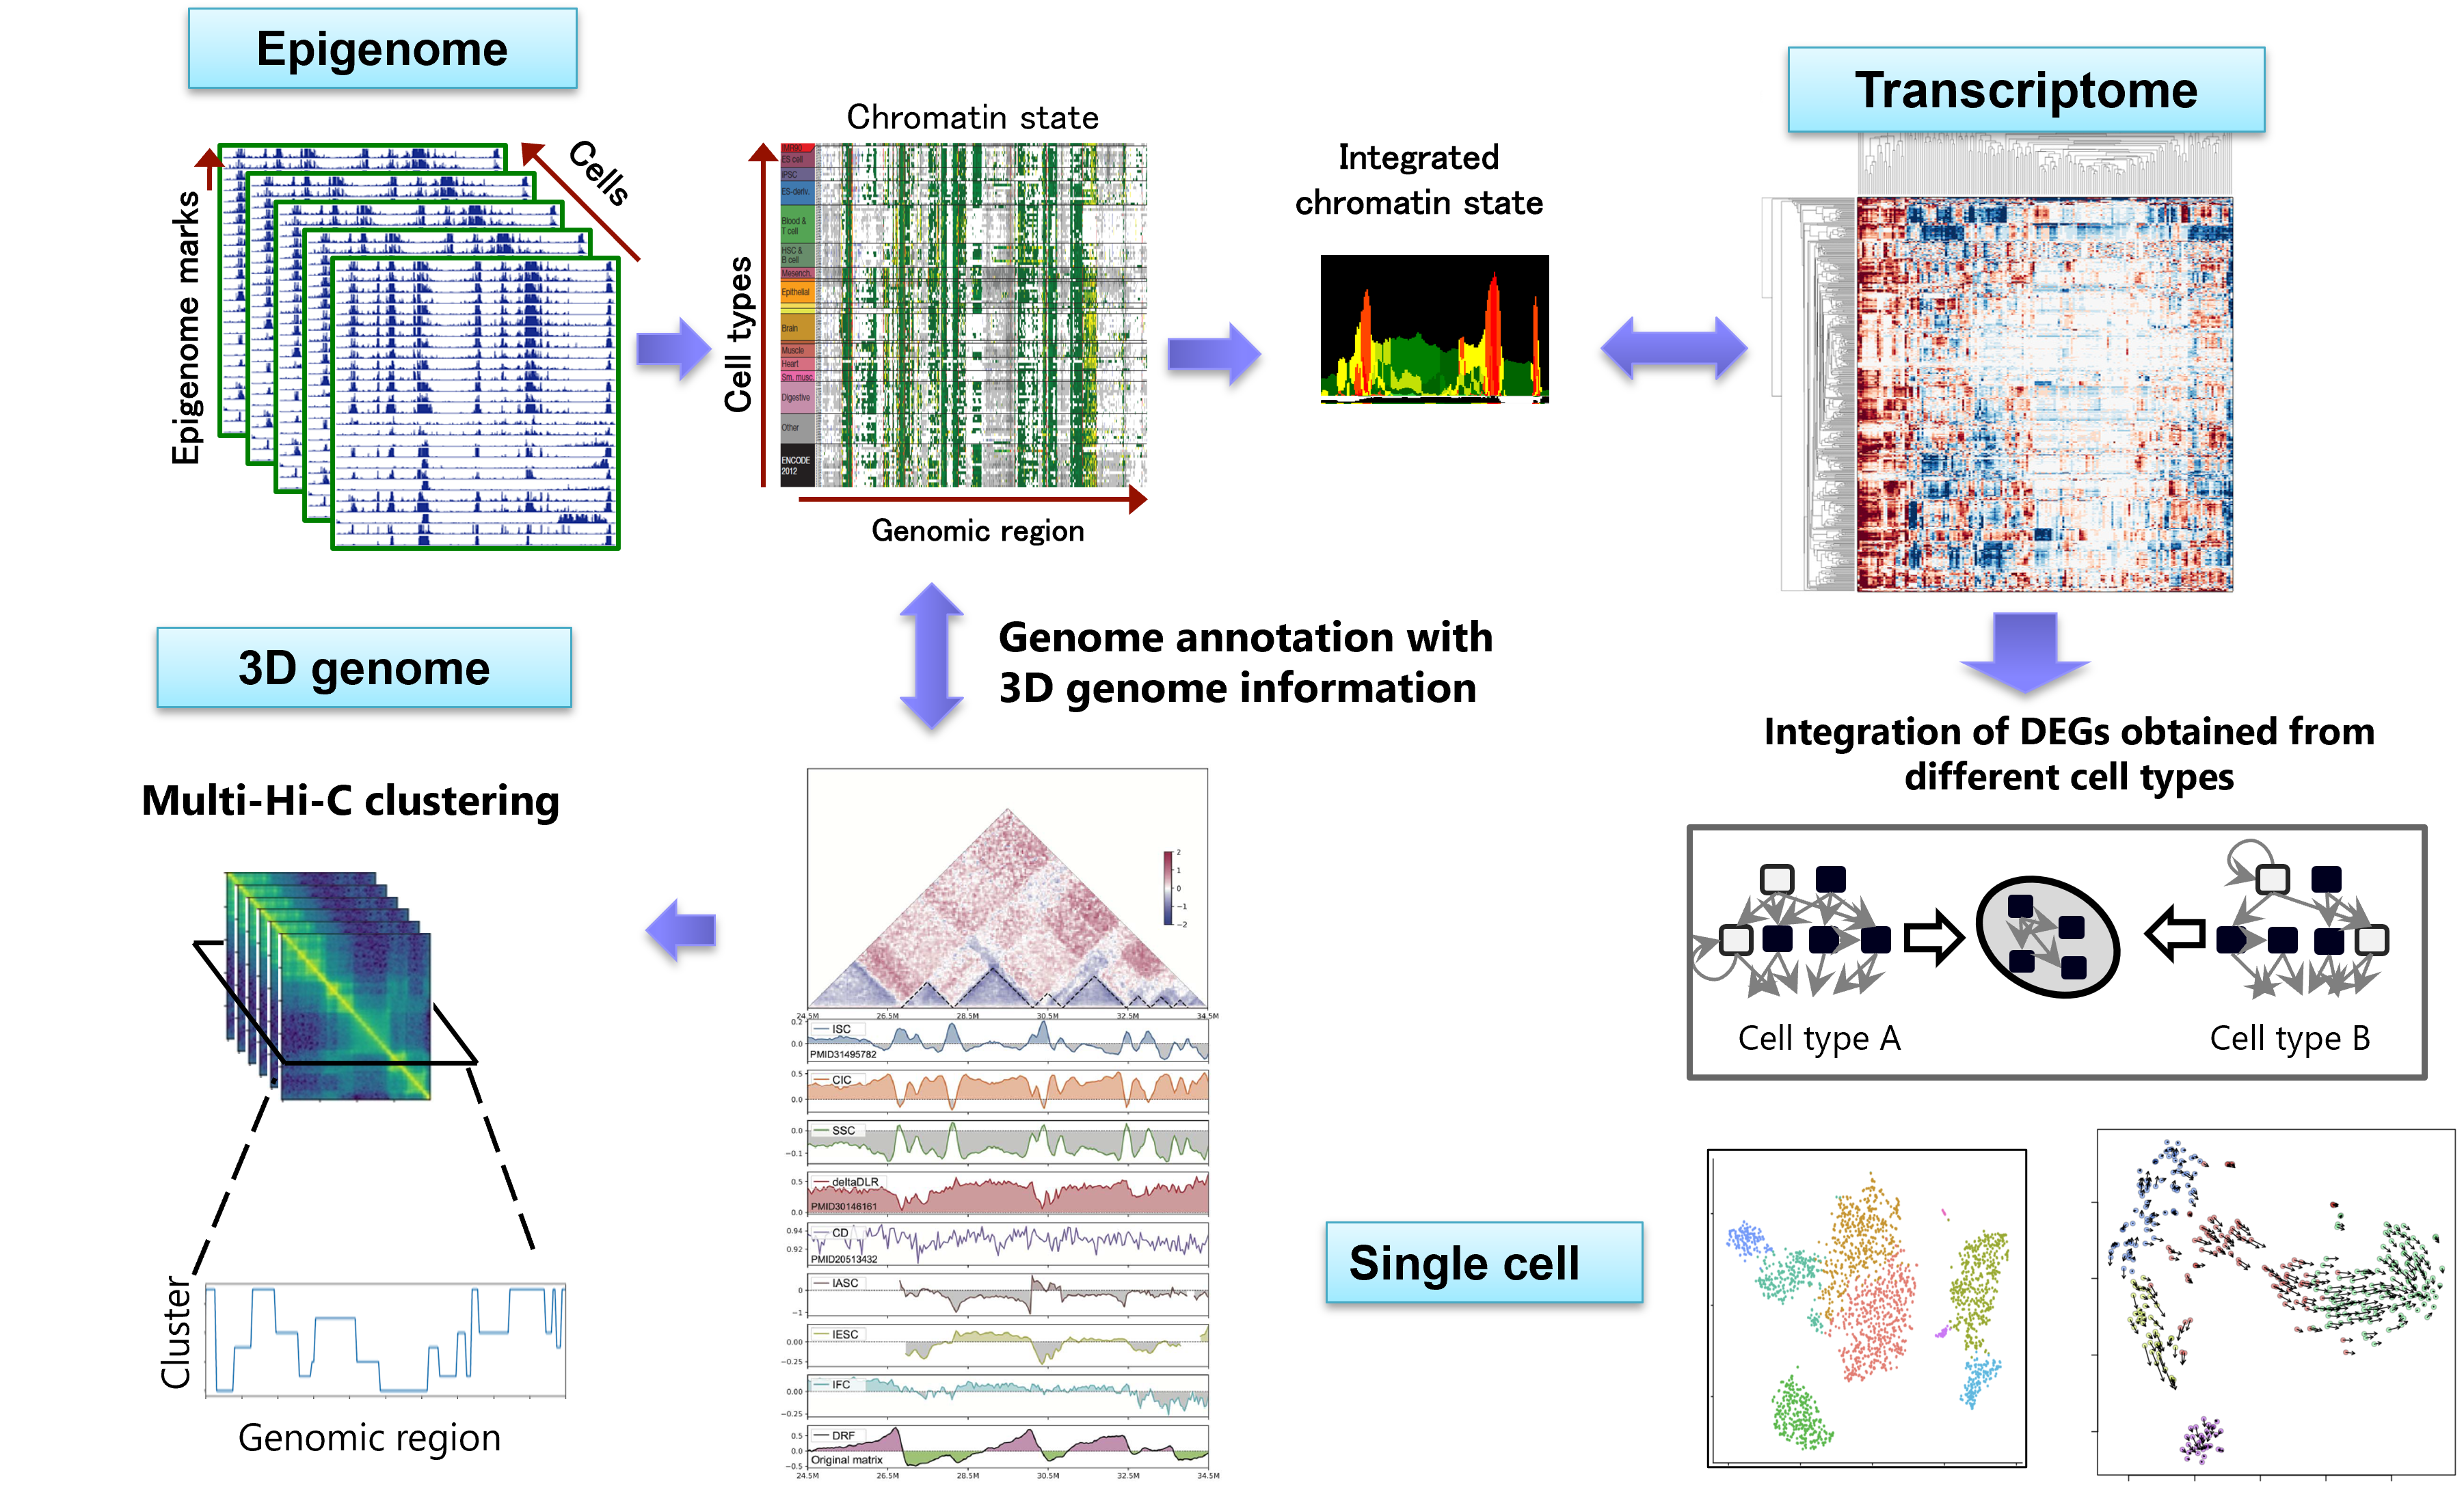
Figure: A large-scale multi-omics analysis platform
Data-driven genome annotation using multi-omics data
In the human genome, only 3-5% of the regions code for proteins, while it has become clear that the remaining non-coding regions are also important for gene regulation and other genomic functions. We try to identify unknown functional regions in the genome in a data-driven manner, without relying on prior knowledge, using large amounts of epigenomic and 3D genome data.
Hi-C/Micro-C analysis identifies 3D genome structure across the entire genome. Previous approaches for comparative analysis have been limited to simple visualization and comparison of compartment structures. We have developed a new 3D genome analysis method, called CustardPy, that systematically compares multiple Hi-C samples and clusters genomic regions. We applied CustardPy to Hi-C data obtained from samples depleted of factors known to be important for the 3D genome (such as cohesin and CTCF). The results showed that TAD boundaries consist of multiple subgroups regulated by different factors, that loss of cohesin function causes epigenome-dependent changes in three-dimensional interactions between TADs, and that the genomic abundance of cohesin differs significantly between compartment A and B regions.
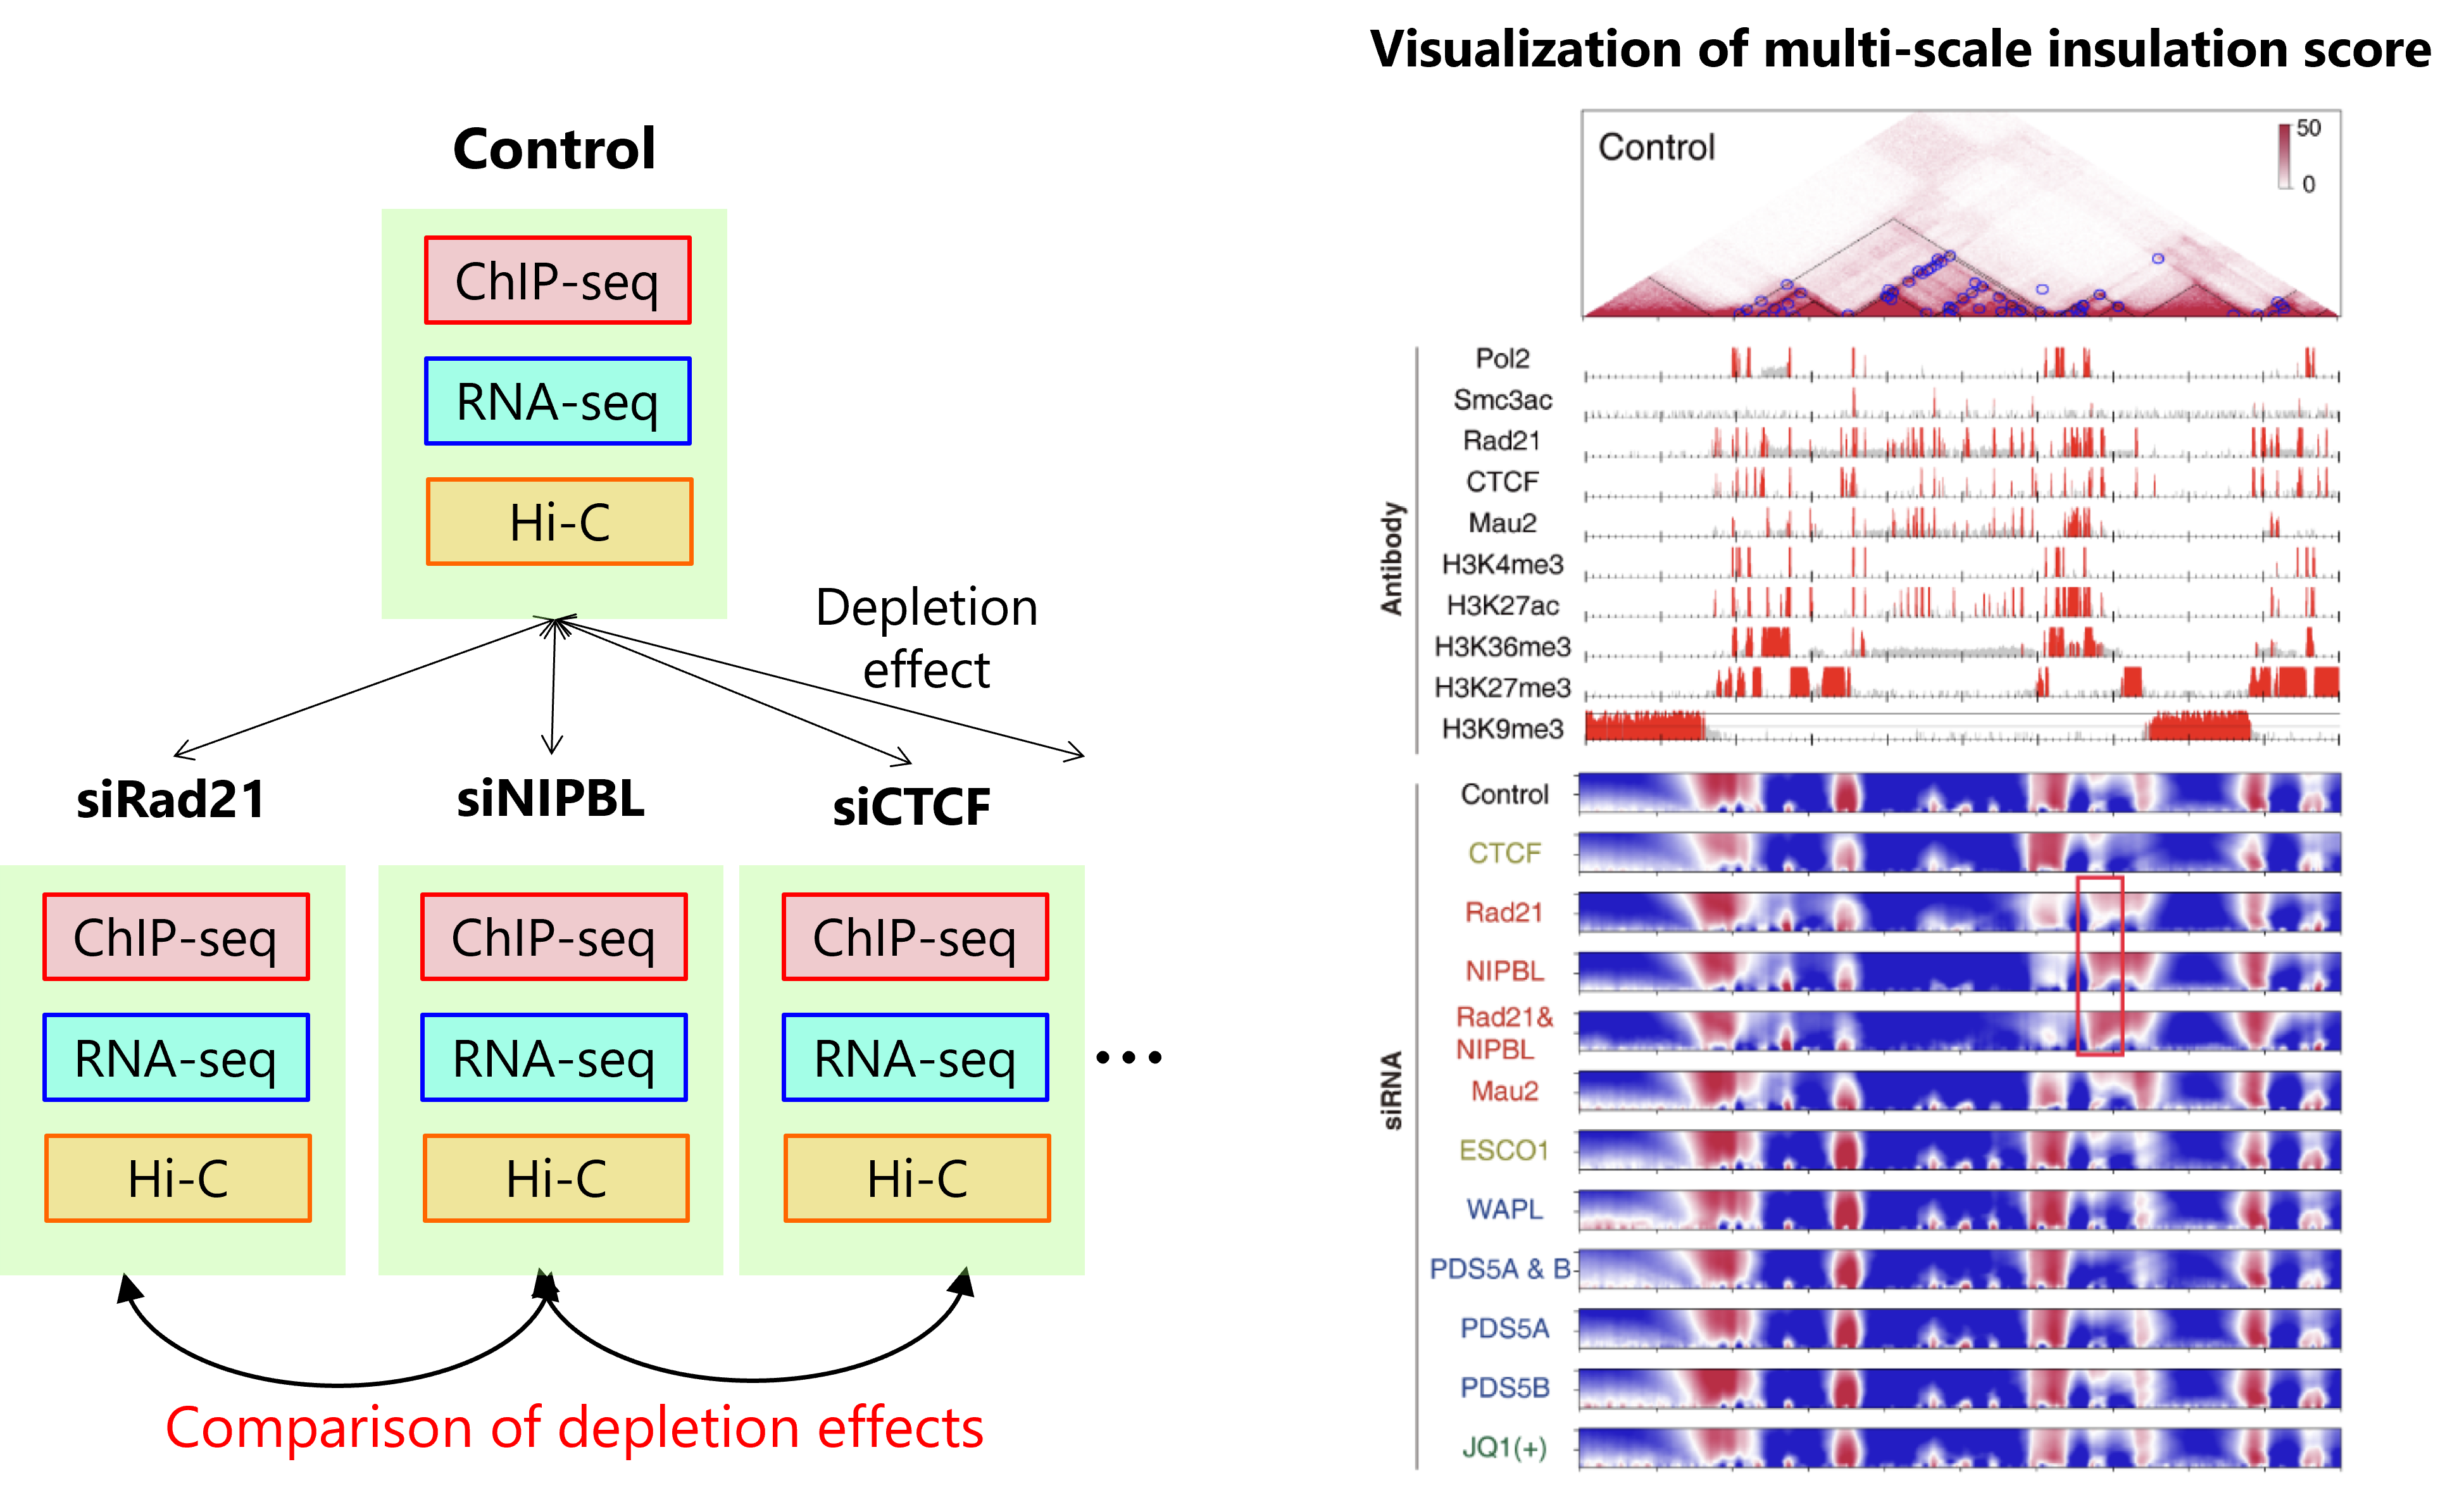
Figure left: We generated multiple samples with depletion of cohesin and related factors and generated multi-omics data. Right: A visualization of the multi-scale insulation score analysis. Top: Hi-C contact map. Middle: Enrichment of factors and histone modifications. Bottom: Multi-scale insulation score. Red regions indicate insulated TAD boundaries.
Prediction and imputation of epigenomic data using a deep learning approach
Taking advantage of the vast accumulation of public epigenome data, we are trying to develop deep learning models to extract important features from epigenomic information, as well as data imputation, to generate virtual epigenomic data in silico.
Chromatin states, fundamental to gene regulation and cellular identity, are defined by a unique combination of histone post-translational modifications. Despite their importance, comprehensive patterns within chromatin state sequences, which could provide insights into key biological functions, remain largely unexplored. We developed ChromBERT, a BERT-based model specifically designed to detect distinct patterns of chromatin state annotation data sequences. By combining the BERT model with modif alignment using Dynamic Time Warping (DTW), ChromBERT enhances the model's ability to analyze chromatin state sequence motifs typically associated with transcription and enhancer sites.
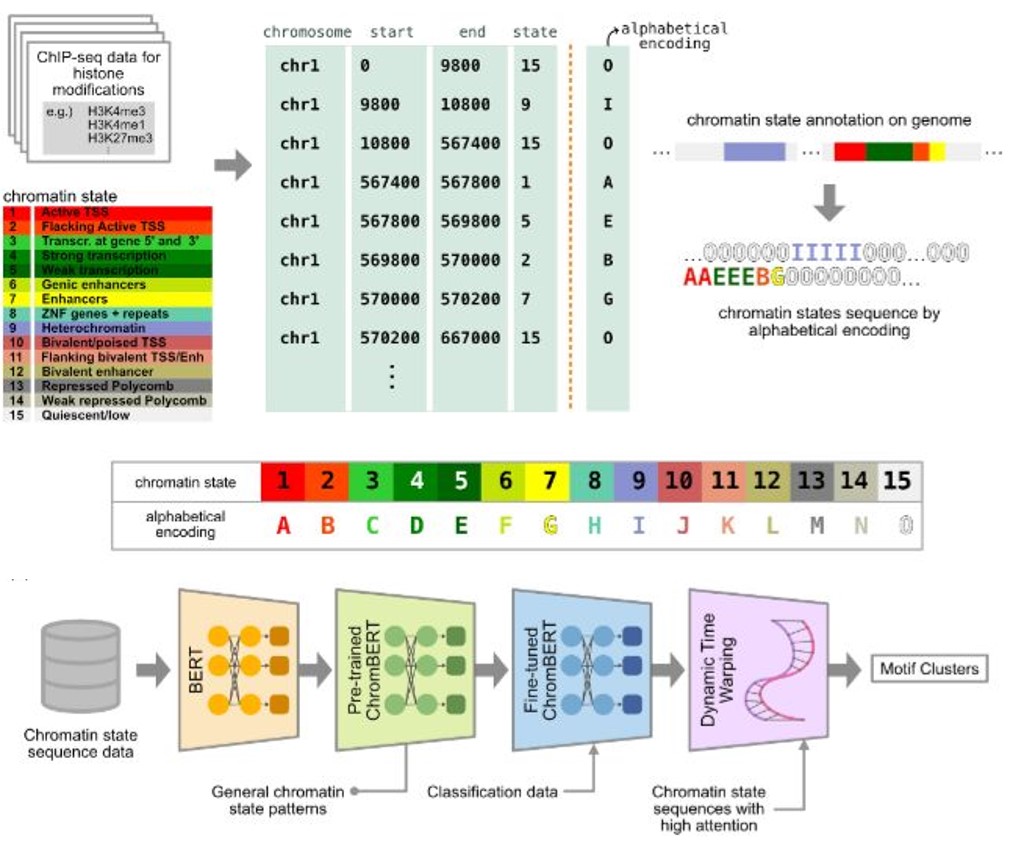
Figure: Overview of ChromBERT
Gene interaction analysis using network theory
We are also working on gene interaction analysis using network theory. Gene regulatory networks represent gene expression control mechanisms as directed graphs, while co-expression networks represent co-expression and mutually exclusive expression patterns of genes as signed undirected graphs. Protein-protein interactions are also commonly used networks. We develop analytical methods to integrate and analyze these heterogeneous networks with different modalities to gain new insights.
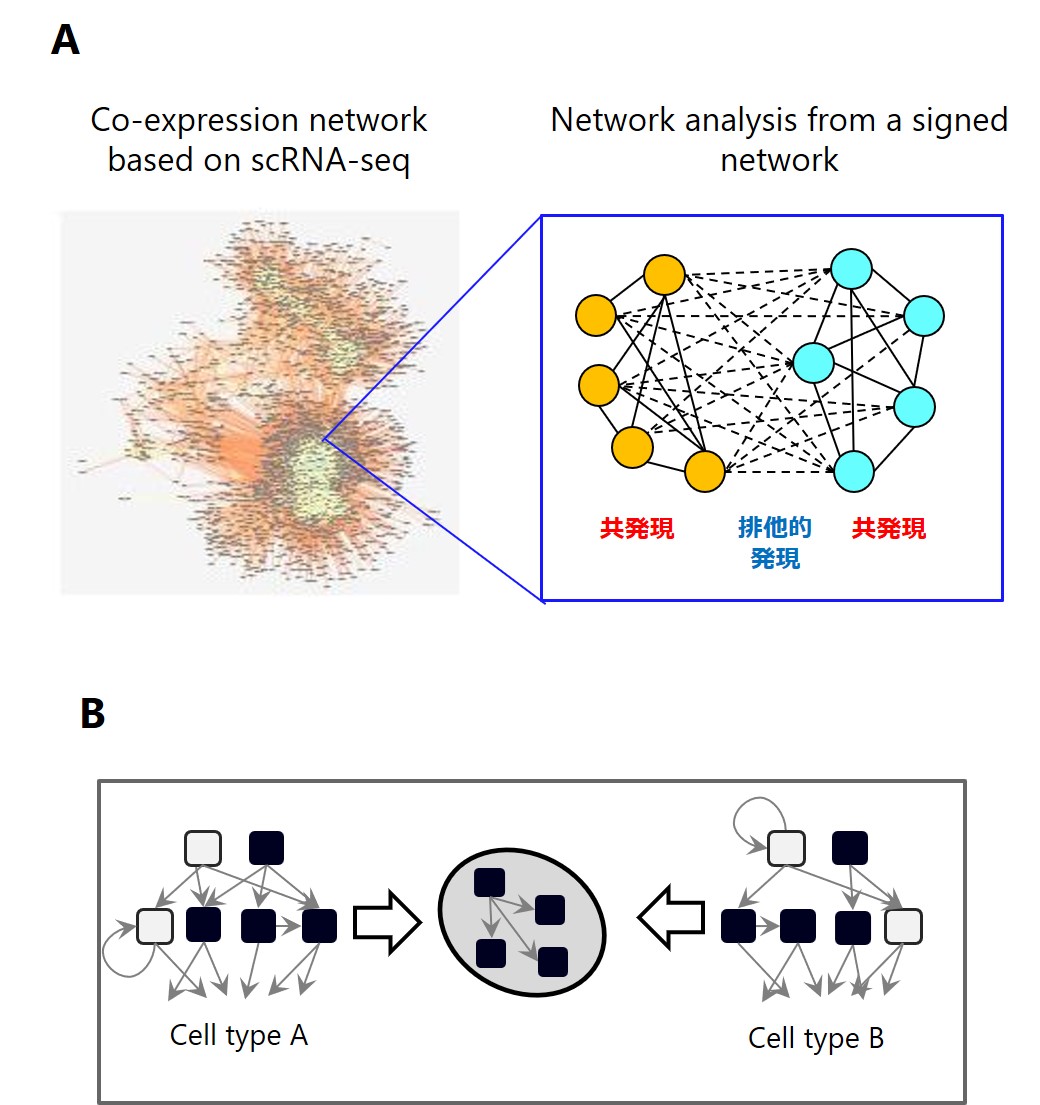
Figure: A: Gene co-expression network analysis using signed networks. B: Integration of experimental results from different cell types using gene regulatory networks.
Various analysis using single-cell methods
Single-cell analysis, which observes genomic information at the single-cell level, is used to observe cellular heterogeneity in tissues and cell differentiation trajectory. We are working on the following projects mainly using single-cell gene expression data (scRNA-seq).
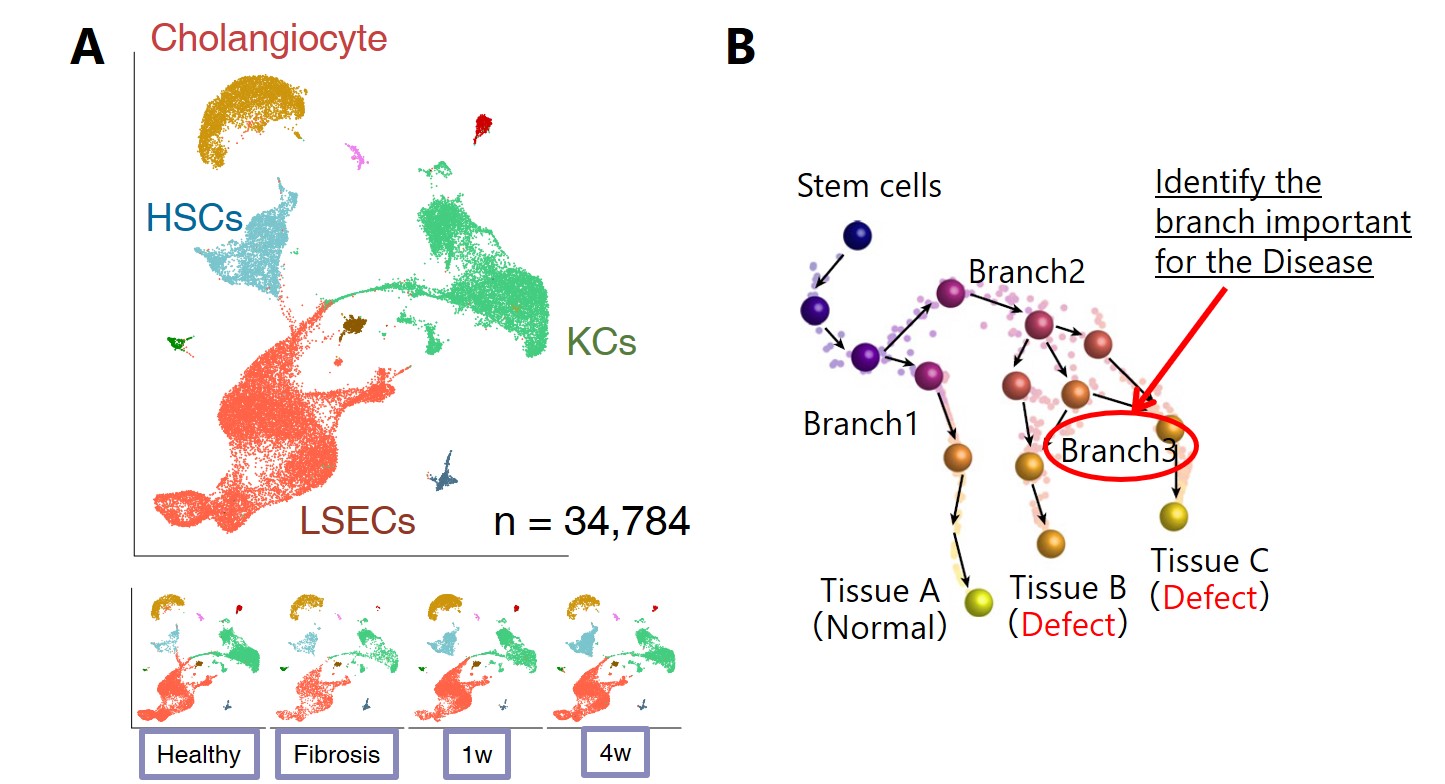
Figure A: Time-course analysis of hepatocellular fibrosis initiation and healing for mouse liver. B: Trajectory analysis using stem cell differentiation system with cohesin disease model.
We are participating in the International Human Epigenome Consortium (IHEC) phase II, where we are working together to develop tools for integrative epigenomic data analysis.
Link: IHEC Team Japan

Group photo at the IHEC Annual Meeting in Banff, Canada in 2023.
Past works
In this project, we developed a computational platform for comparative epigenomic analysis of datasets obtained from multiple NGS assays, such as ChIP-seq, RNA-seq, and Hi-C, and released Docker-based NGS analysis pipelines (Churros, RumBall, CustardPy, ShortCake). Using these technologies, we have obtained various biological insights and published several papers.
We have developed a new method, HiC1Dmetrics, which can efficiently extract a variety of one-dimensional features from Hi-C data. In this method, we have developed several new metrics that can quantitatively extract specific 3D structures, such as chromatin hubs. These metrics are effective for integrating 3D information into the SAGA approach.
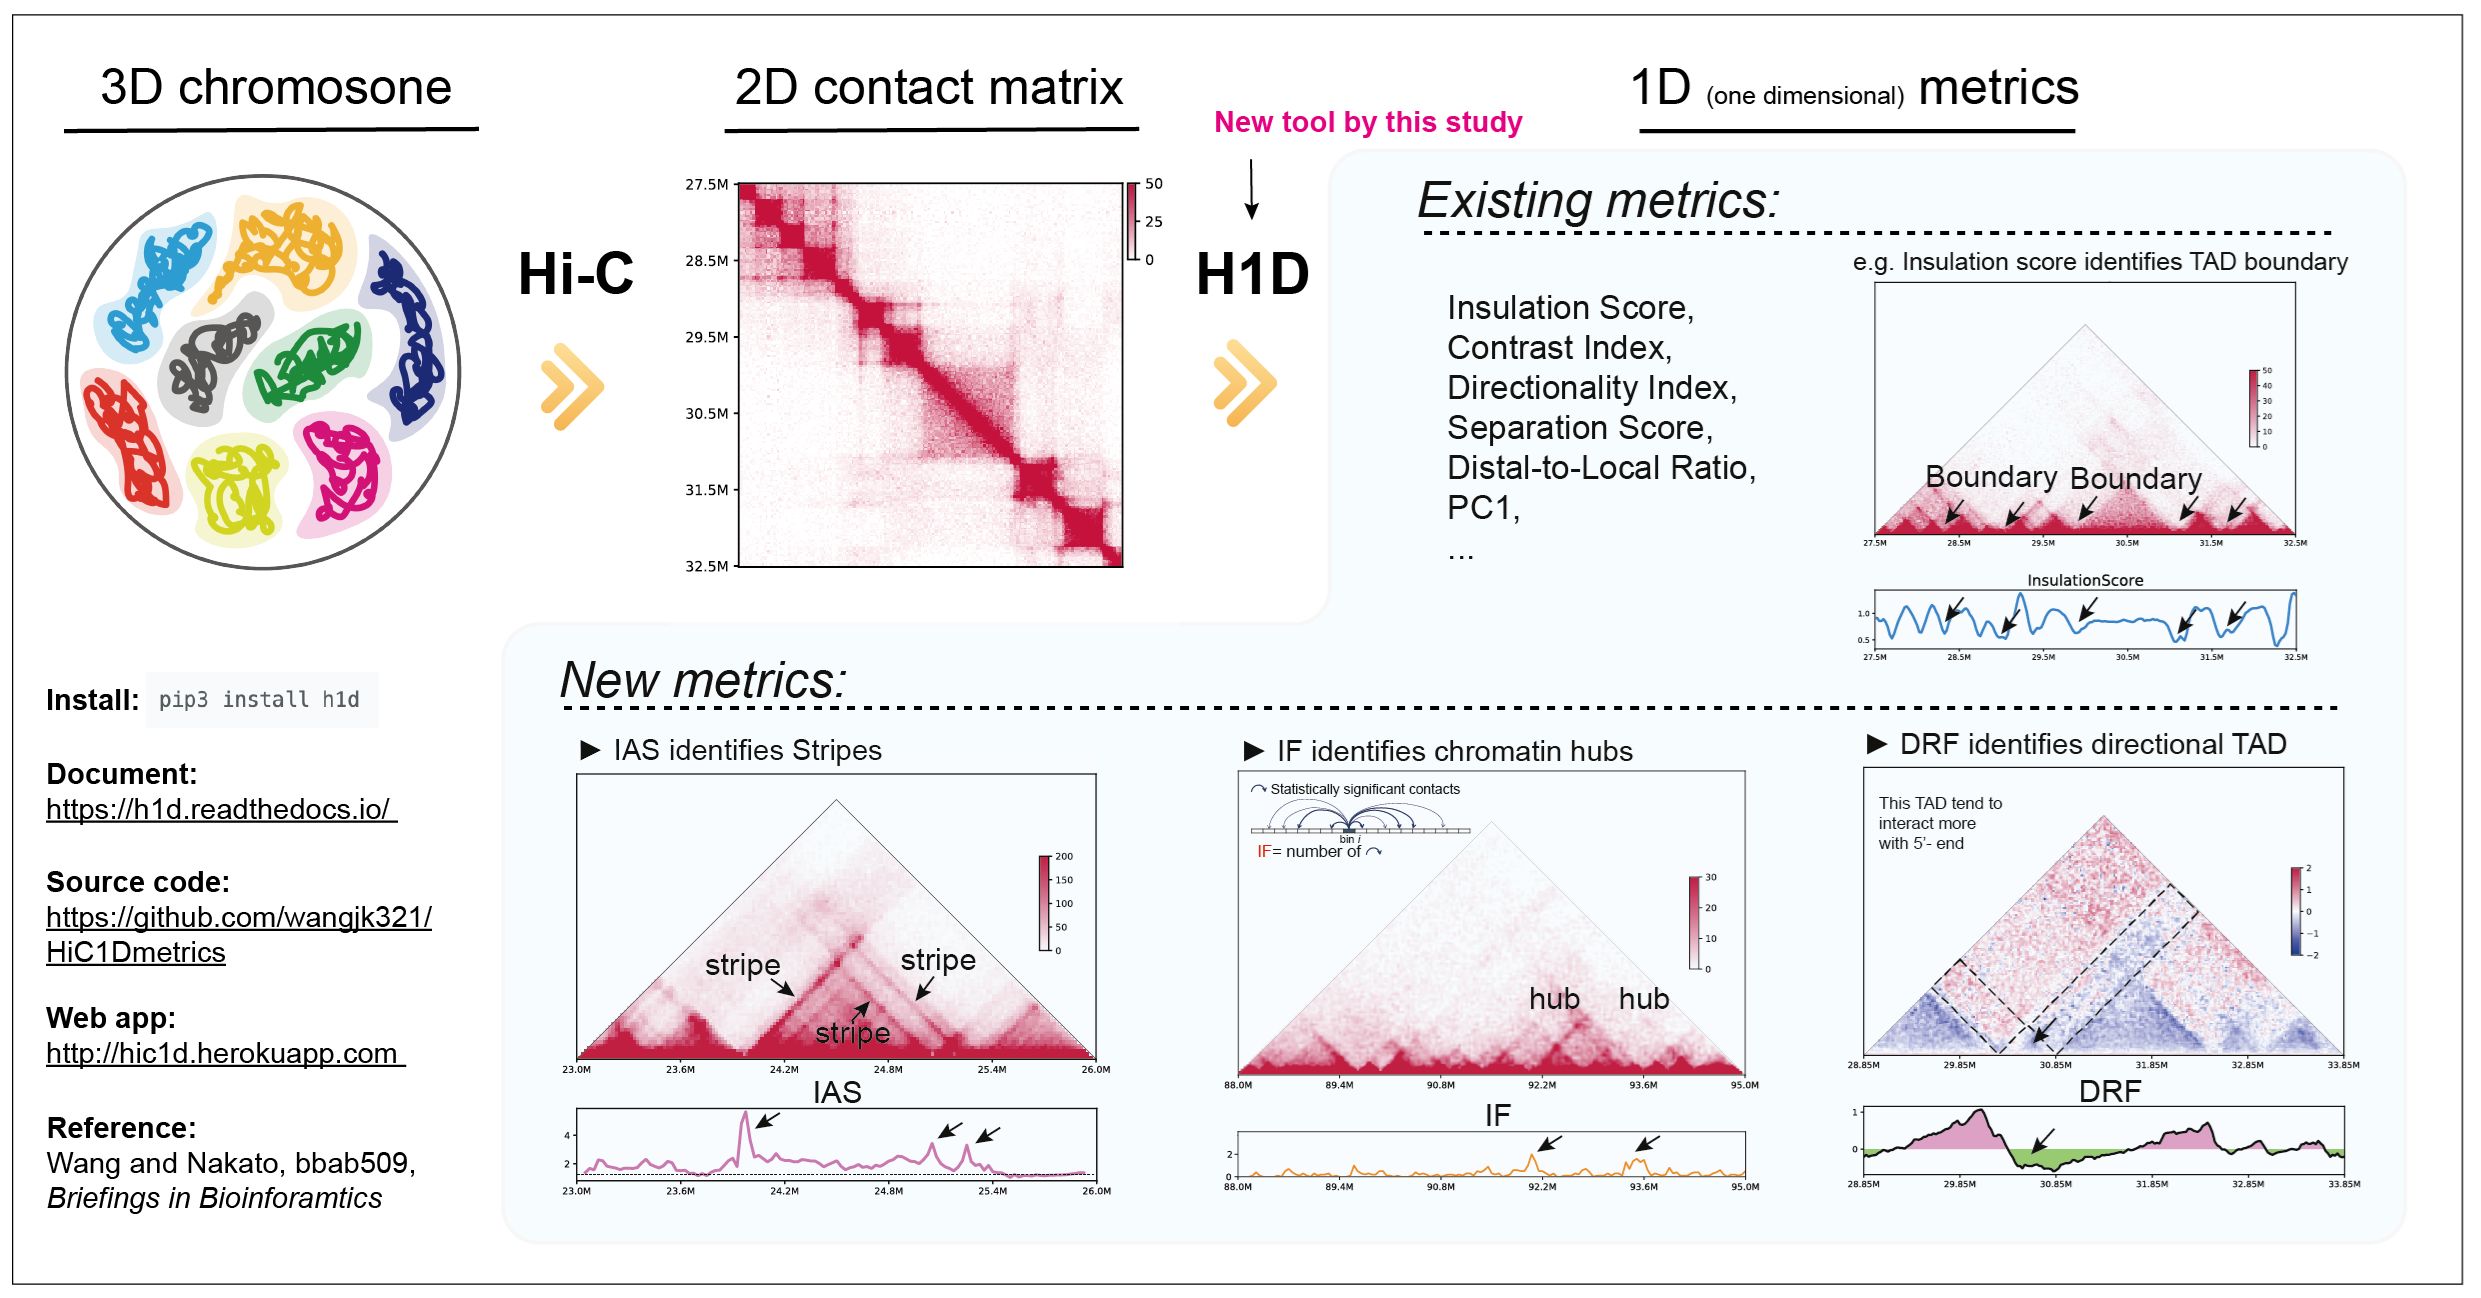
Figure: Overview of HiC1Dmetrics
Cohesin is involved in gene regulation by various mechanisms, including the mediation or insulation of enhancer-promoter loops, the formation of topologically associating domains (TADs) by loop extrusion, and RNA polymerase II elongation. Although the mutation of cohesin and cohesin loader causes a developmental syndrome with a complex phenotype Cornelia de Lange syndrome (CdLS) and several types of cancer, an underlying molecular mechanism is still unclear.
We found a small fraction of cohesin binding sites and mediated chromatin loops located in intragenic regions that are negatively correlated with transcriptional activity, i.e., transcriptional activation of host genes attenuates binding. To characterize the decreased intragenic cohesin sites (DICs), we performed a large-scale multi-omics analysis using more than 100 NGS samples, consisting of ChIP-seq, RNA-seq, Hi-C and ChIA-PET. The analysis revealed that cohesin seems to have a negative regulation mechanism of transcription by binding or inhibiting RNA Pol2 elongation, and this function seems to fluctuate in patients with cohesin disease.
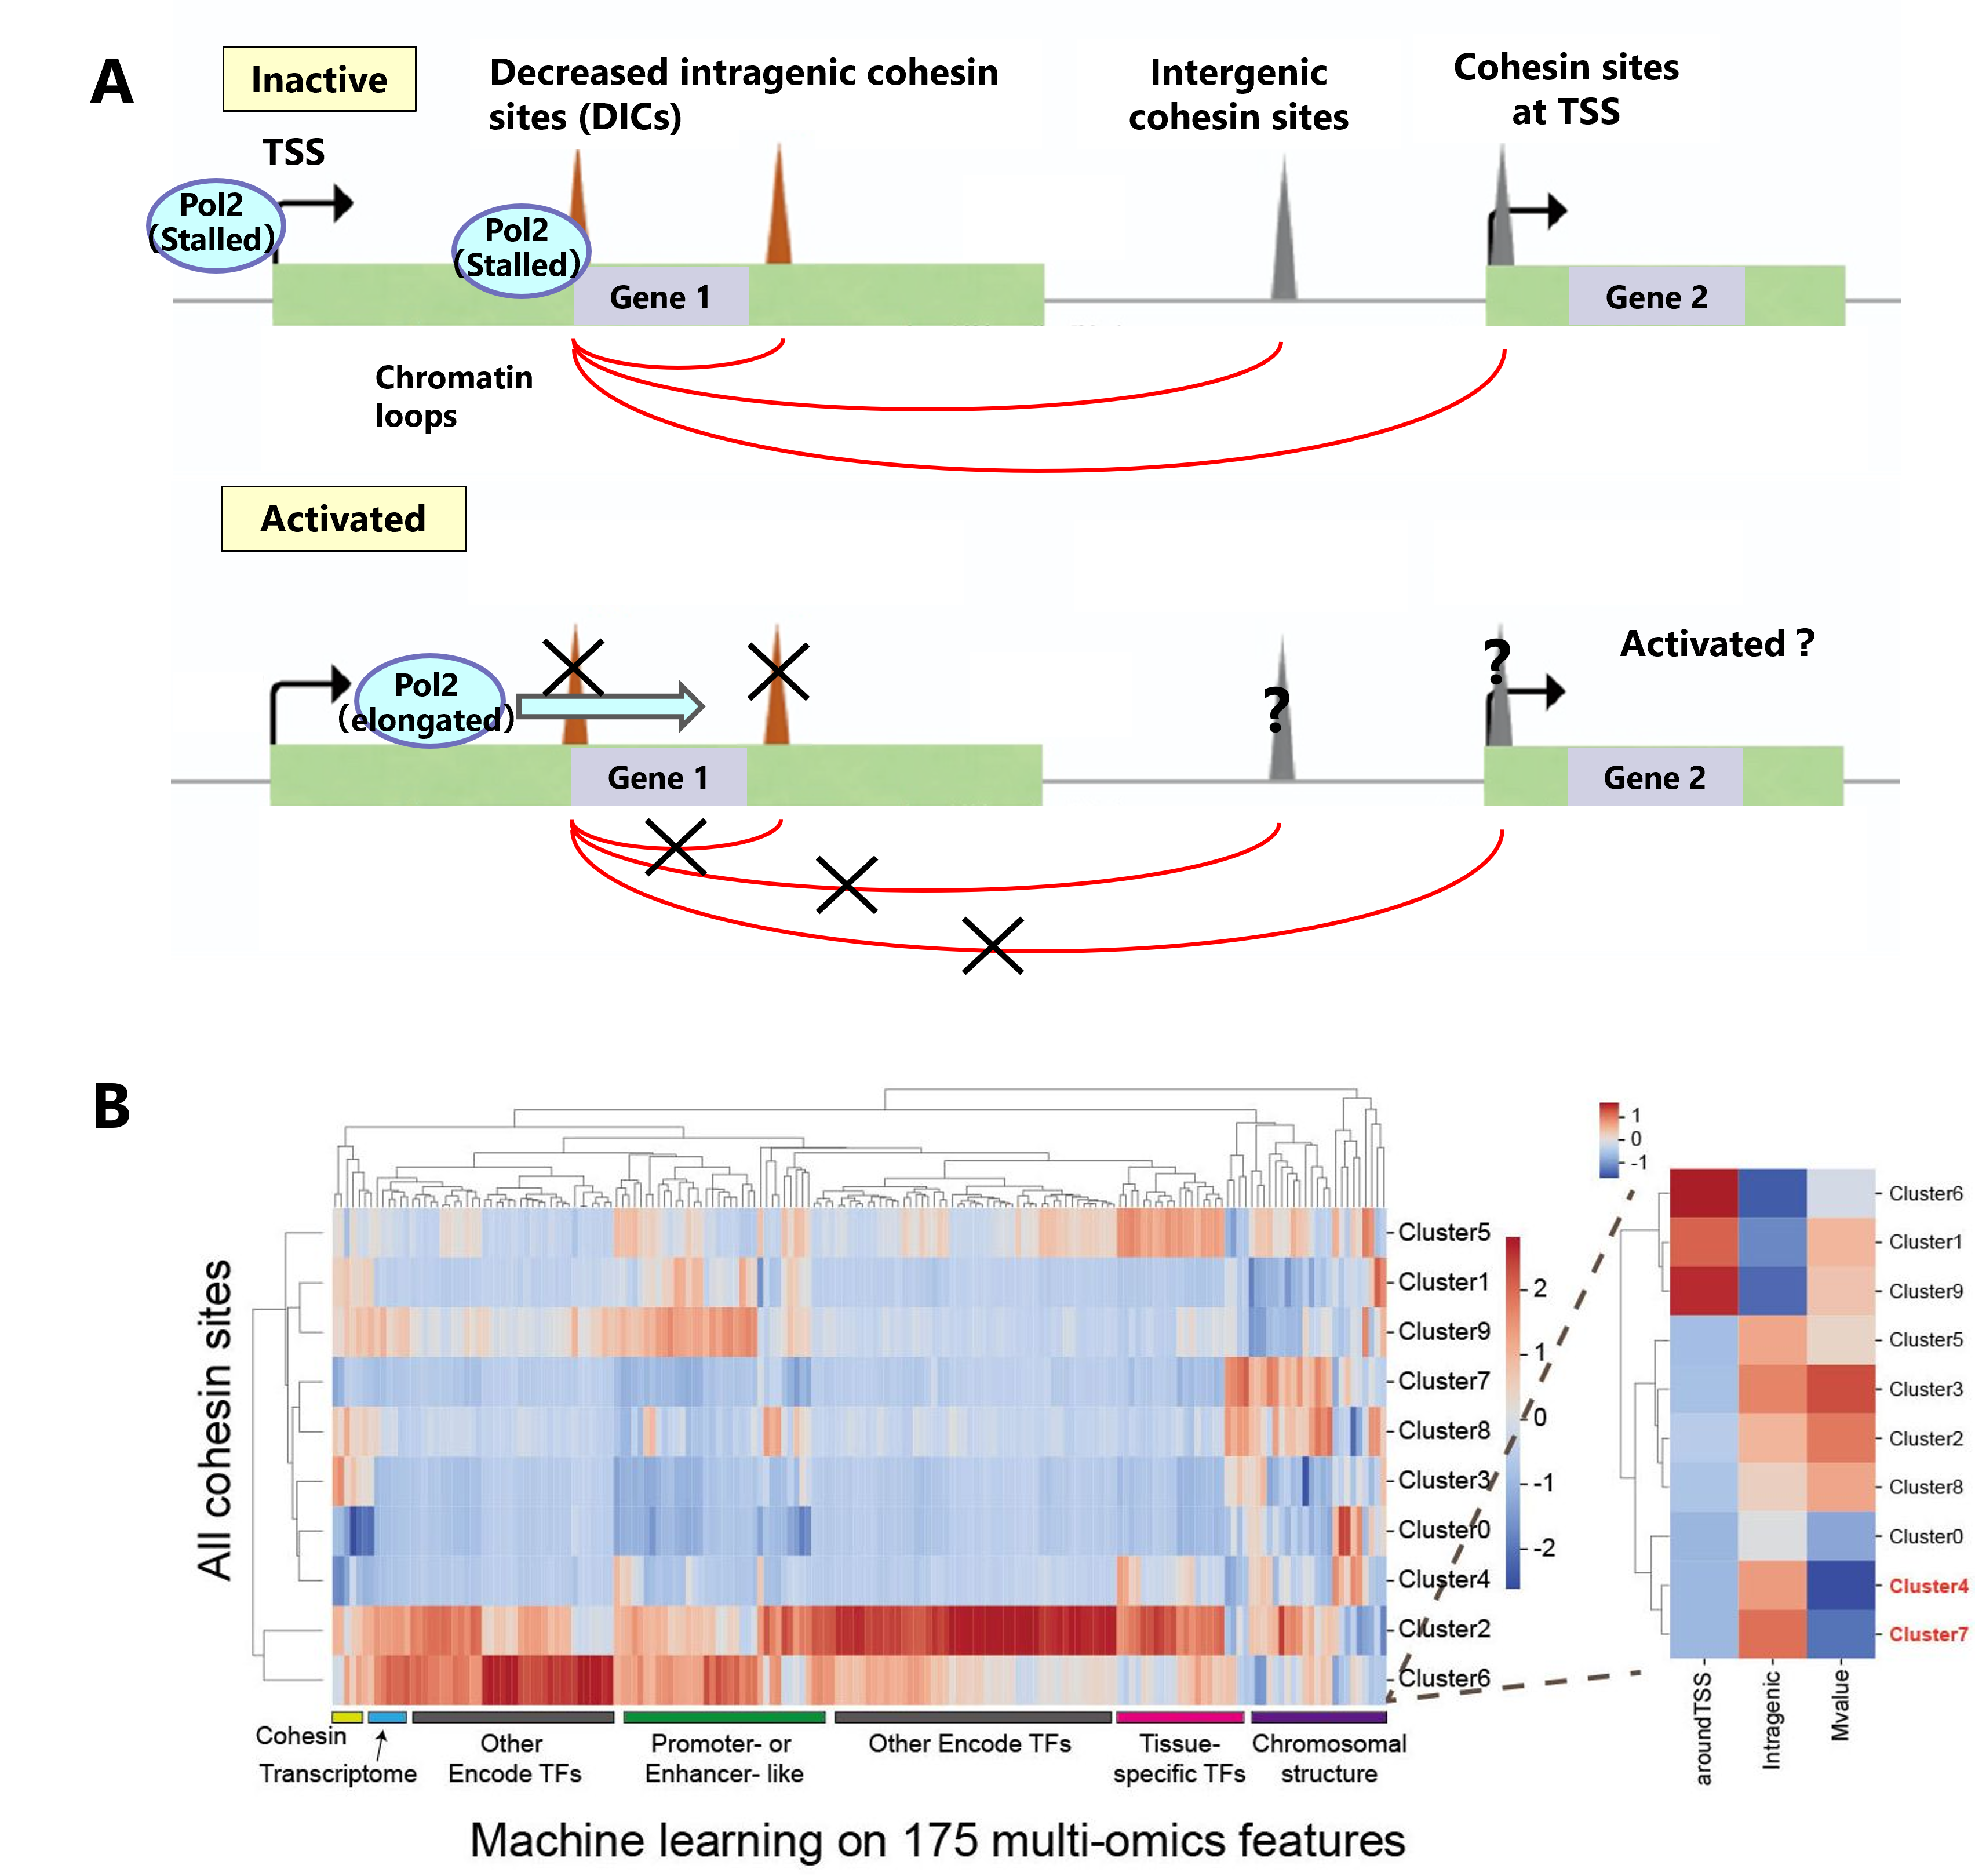
Figure A: We found that the decreased intragenic cohesin sites (DICs) that bind are attenuated by gene activations. B: We implemented a machine learning approach to characterize the DIC sites using multi-omics data.
Grant-in-Aid for Scientific Research on Innovative Areas "Integrated analysis and regulation of cellular diversity"
Single-cell analysis pipeline ShortCake [中戸, 実験医学, 2021]
We have developed a computational platform for single-cell analysis, ShortCake. By downloading the Docker image, users can use different tools for single-cell analysis on any platform. ShortCake can be used in the CUI (command line) and the GUI (Jupyter notebook and RStudio). Since ShorCake does not rely on the big cluster server, it is not affected by server failures and shutdowns.
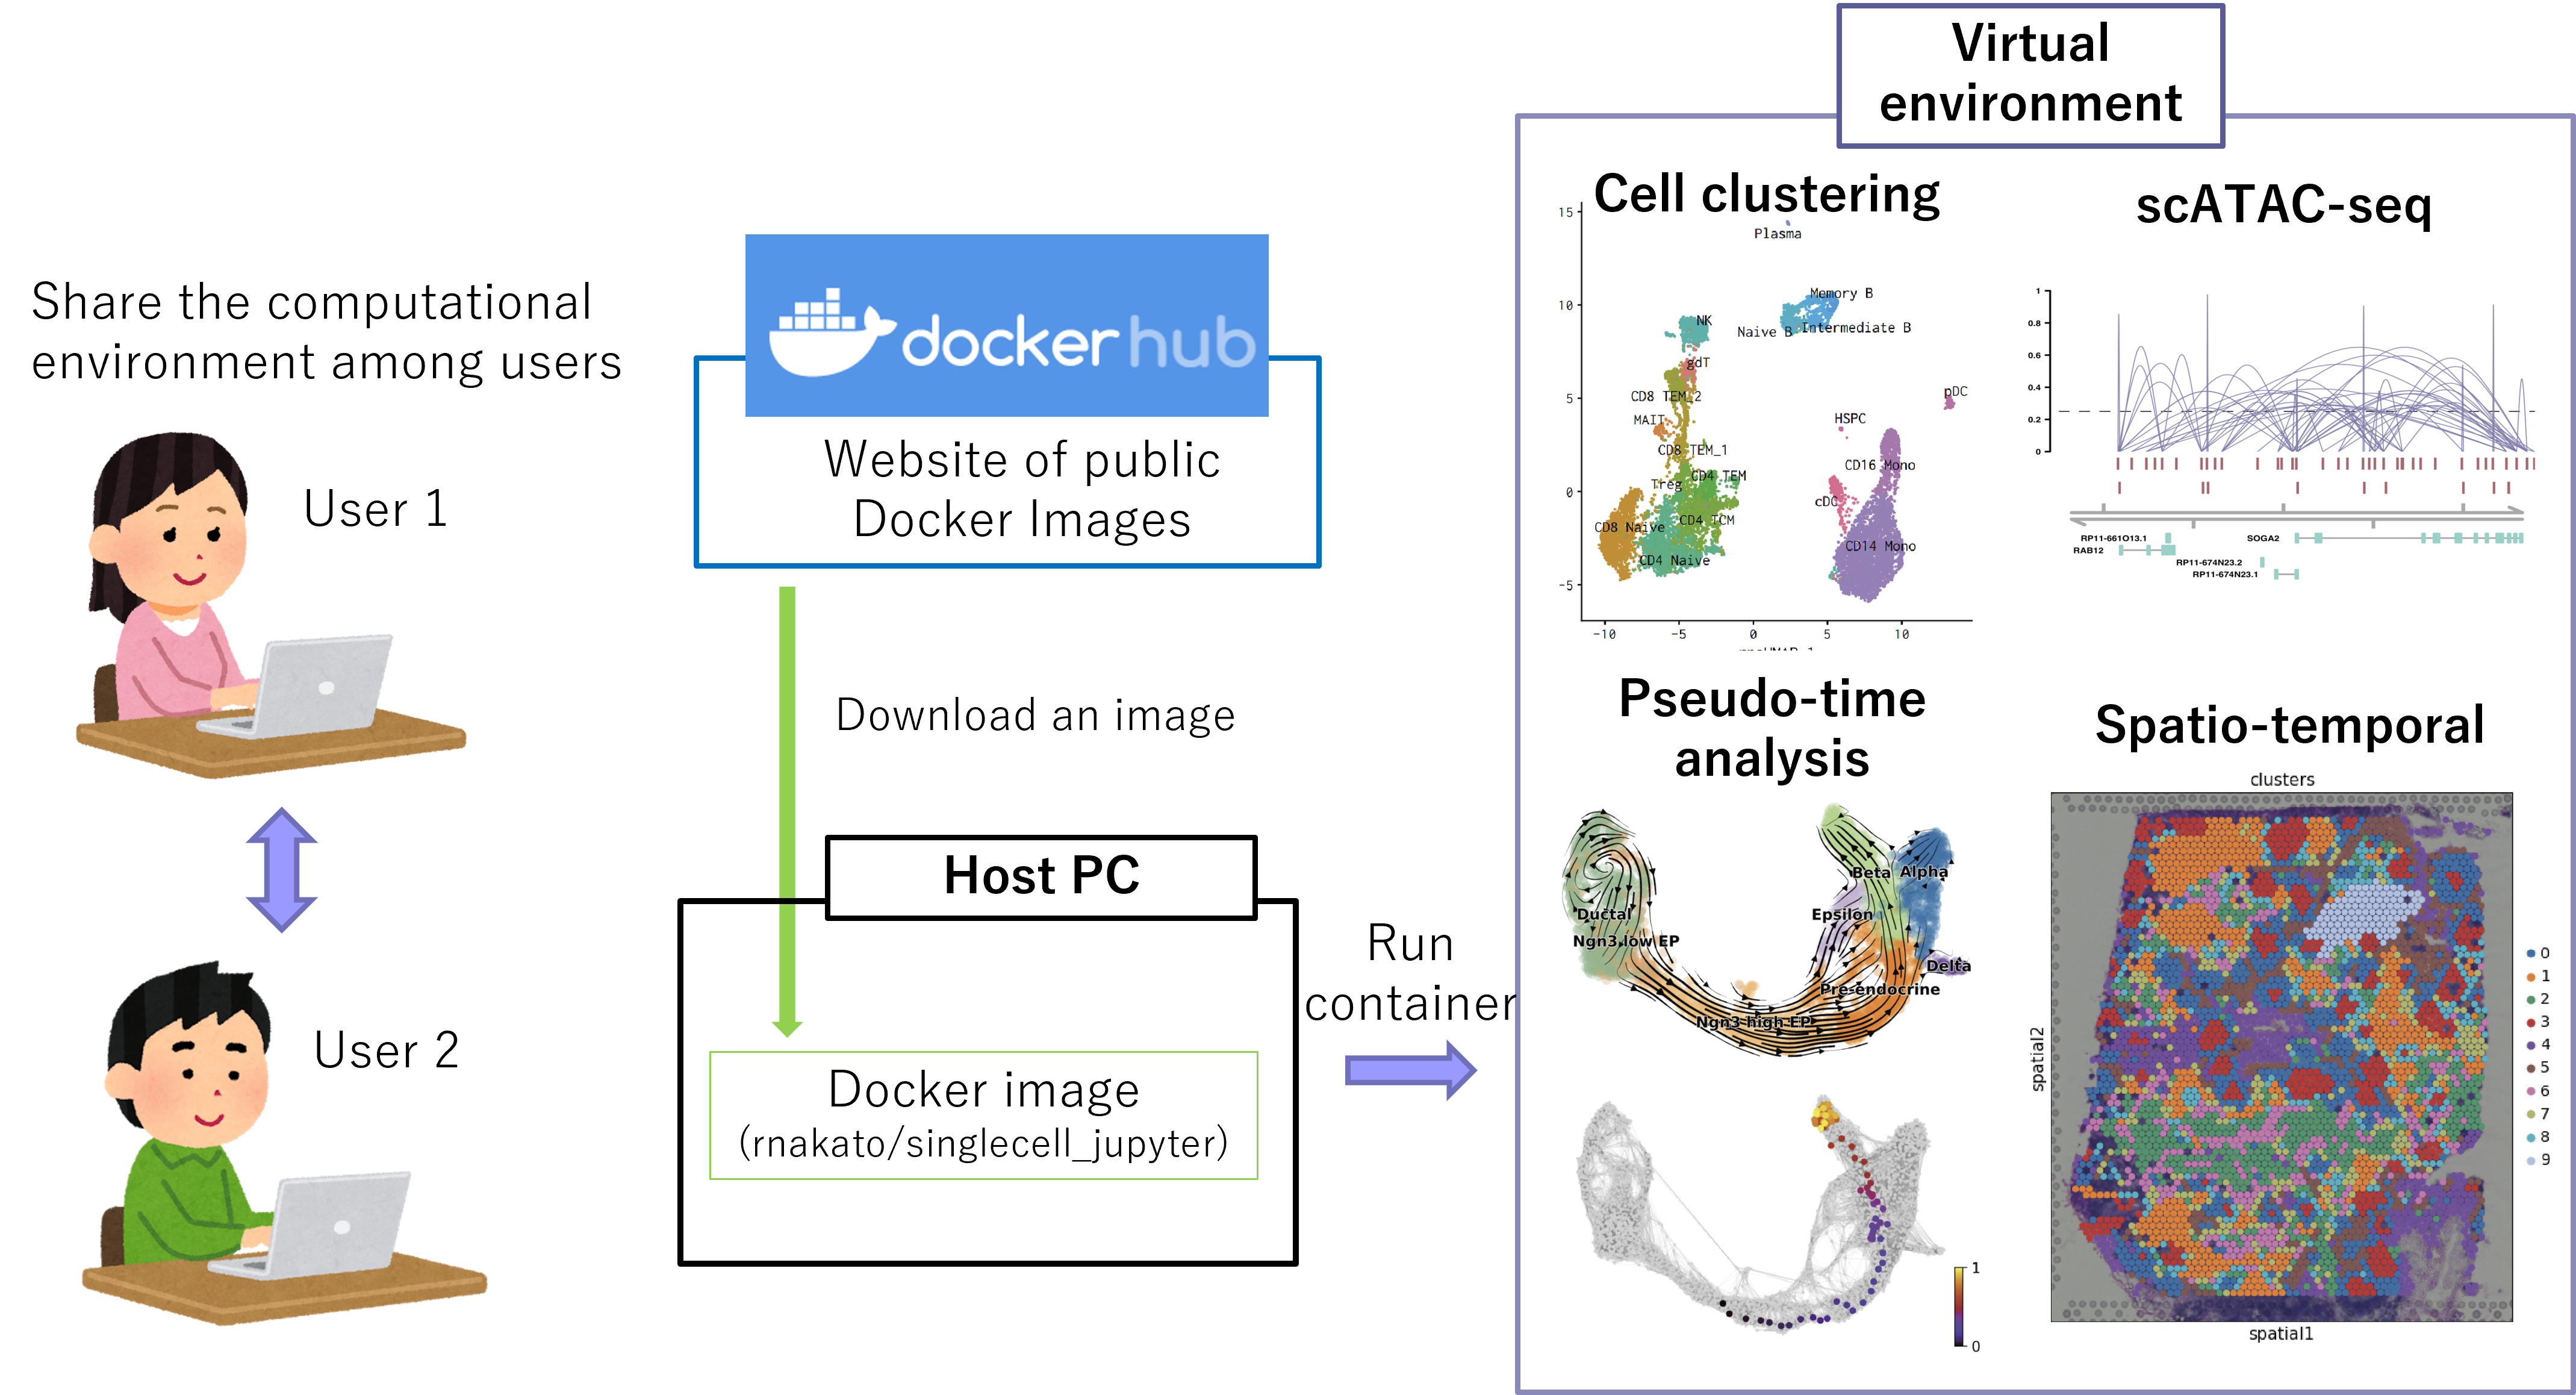
Figure: Overview of ShortCake
We have also developed a new approach EEISP, which robustly estimates gene co-expression and and mutual exclusivity from sparse scRNA-seq data. By applying this method to glioblastoma stem cell data and conducting comparative analysis of gene networks between stem cells and non-stem cells, we identified several new marker gene candidates of cancer stem cells.
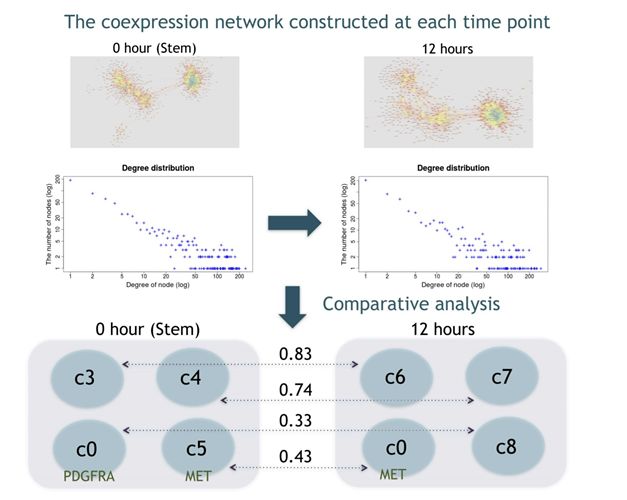
Figure: Gene co-expression network estimation and network comparison from sparse scRNA-seq data
Epigenome database project for human vascular endothelial cells (ECs)
As a part of the International Human Epigenome Consortium (IHEC), we cataloged gene expression and active histone marks in different types of human endothelial cells (ECs) from multiple donors and developed a database site.
・ Human Endothelial Epigenome Database
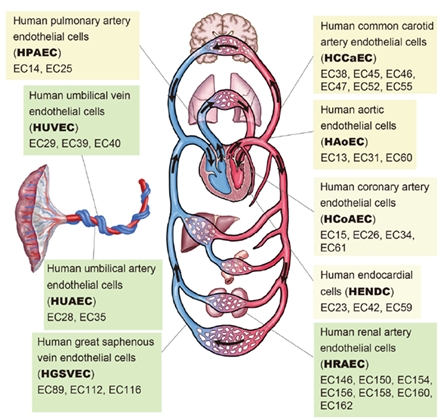
Figure: Schematic illustration of the cardiovascular system.
This indicates nine EC types and 33 individual samples (indicated by the prefix “EC”) used in this study.
Using this database, we performed a comprehensive analysis with chromatin interaction data to understand their diverse phenotypes and physiological functions .
We developed a robust procedure for comparative epigenome analysis that circumvents variations at the individual level and technical noise. Through this approach, we identified 3,765 EC-specific enhancers, and some of them were associated with disease-associated genetic variations (GWAS).
We also identified various candidate marker genes for each EC type. Notably, many homeobox genes were differentially expressed across EC types, and their expression was correlated with the relative position of each body organ. This reflects the developmental origins of ECs and their roles in angiogenesis, vasculogenesis, and wound healing.
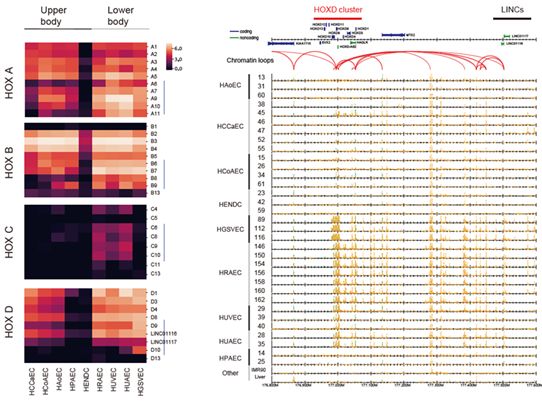
Figure 7: Differential expression of HOX genes across nine EC types.
Left: heatmaps visualizing the gene expression of four HOX clusters.
Right: read distribution of the enhancer marker H3K27ac (highlighted in orange) around the HOXD cluster. Red arcs indicate chromatin loops obtained by ChIA-PET analysis.
Unlike other NGS assays such as RNA-seq, ChIP-seq analysis requires the generation of multiple data from a single sample (e.g., multiple histone modifications), which often leads to many samples and cumbersome analysis. We have developed DROMPAplus, a pipeline tool for efficient comparative analysis of such large numbers of ChIP-seq data. It can be used for various quality assessments, fragment length estimation, PCR bias filtering, normalization, peak extraction, and visualization.
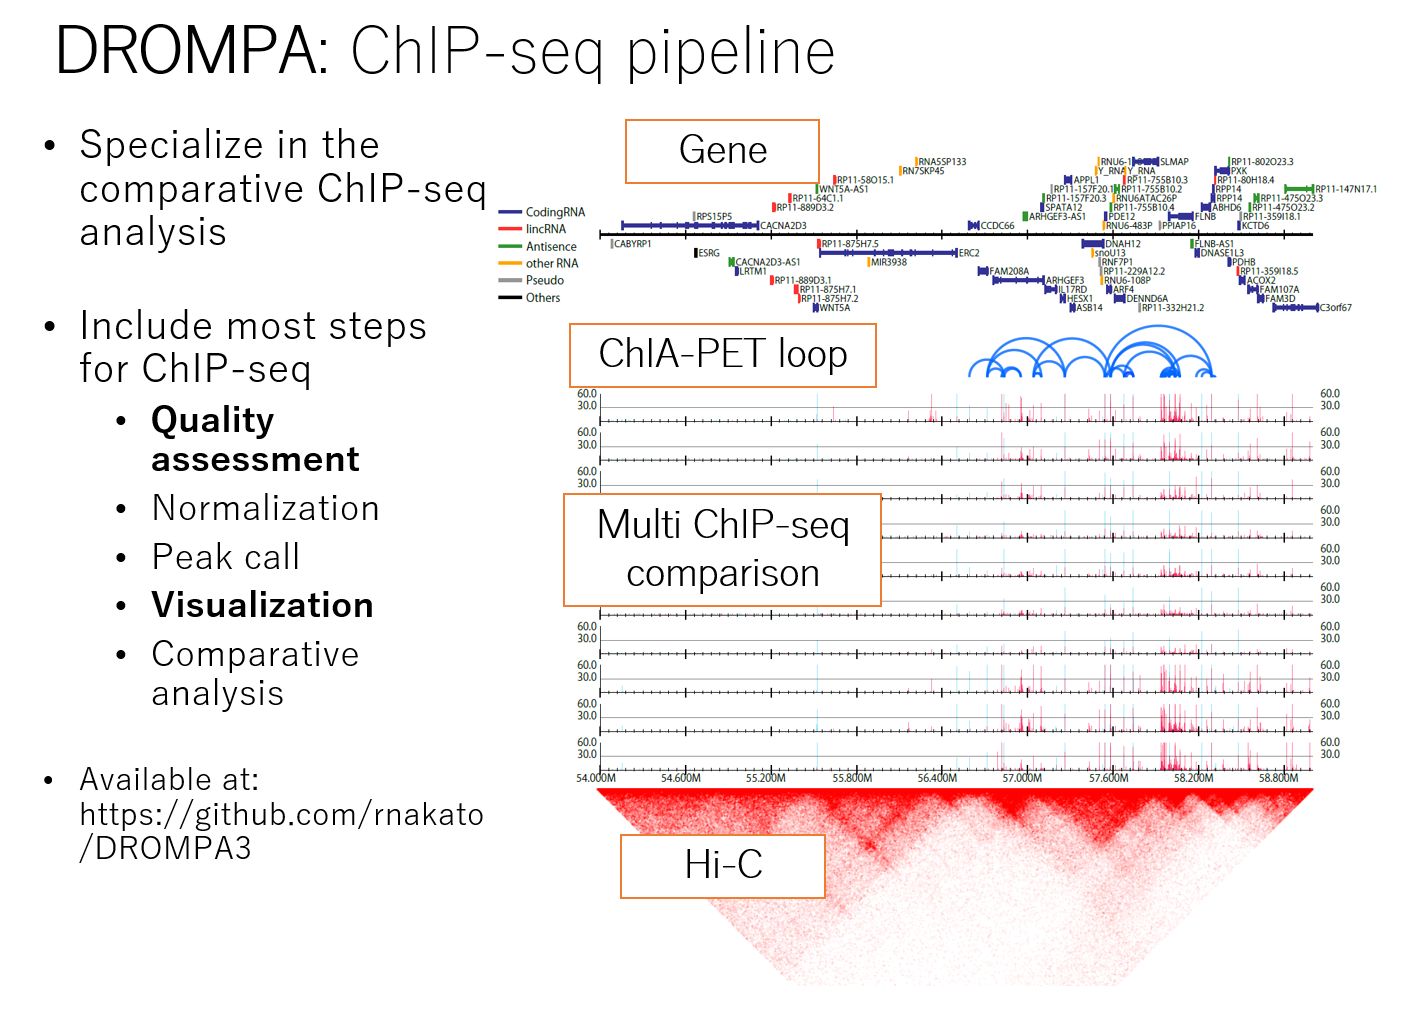
Figure: Summary of DROMPAplus
In large-scale NGS analysis, the quality of input samples is absolutely critical, and one-by-one checking is difficult; therefore, objective quality metrics are essential to filter poor-quality data automatically. However, in the EC epigenome project (see above), poor-quality data were present even after removing the low-quality samples identified by recommended quality metrics.
Therefore, we developed SSP, a new quality assessment tool for ChIP-seq analysis. SSP provides a quantifiable and sensitive score for different S/Ns for both point- and broad-source factors, which can be standardized across diverse cell types and read depths. SSP also provides an effective criterion to determine whether a specific normalization or rejection is required for each sample, which cannot be estimated by other currently available quality metrics.
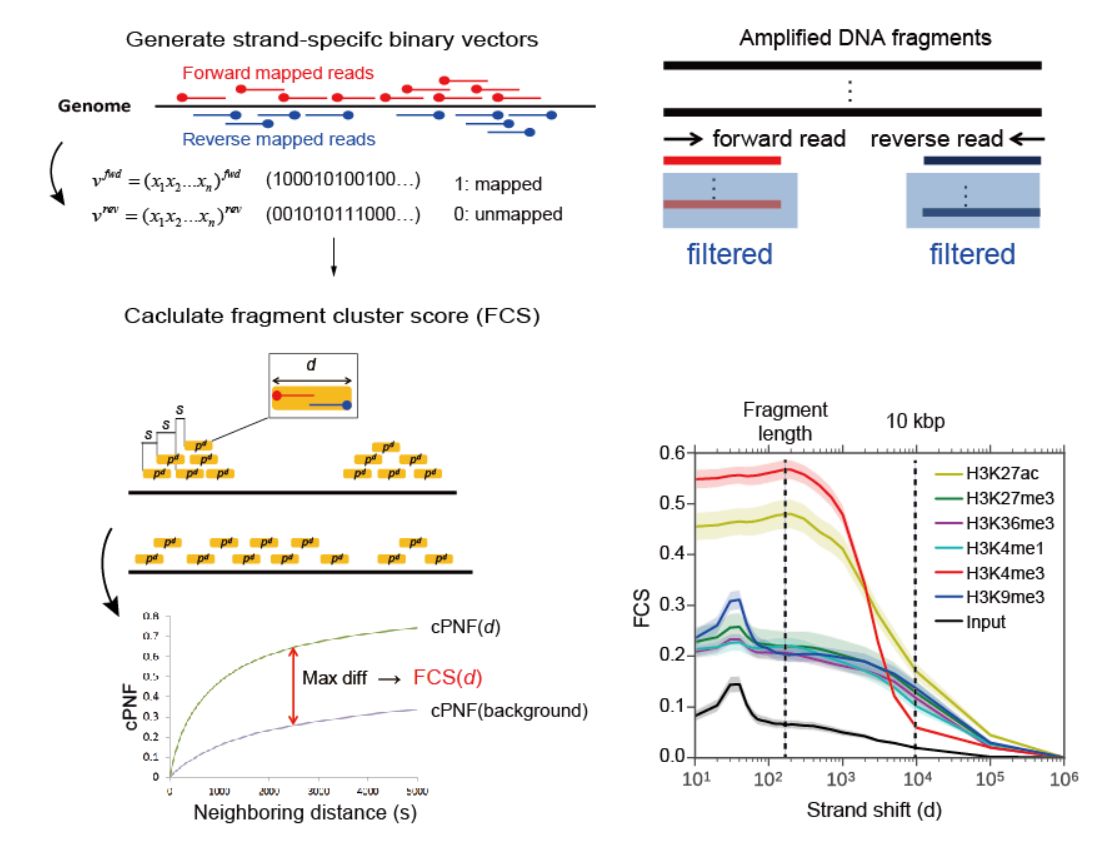
Figure: SSP: Sensitive and robust assessment of ChIP-seq read distribution
using a strand-shift profile